Jasper Bongertz is a Senior Technical Consultant at Airbus Defence and Space CyberSecurity. He is focusing on IT security, Incident Response and Network Forensics.
During the IPv6 summit on Troopers16 he had given a talk on anonymization IPv6 in PCAPs and presented his new tool.
Continue reading “Anonymization IPv6 in PCAPs – Challenges and Wins”
Tag: pcap
BlackBerry 10 USB Modes
So we got these shiny new BlackBerry Q10 and Z10 device laying on the desk one morning. It’s my first BlackBerry, I have to admit, but never the less, the hole wushy GUI and touchy glass stuff wasn’t my main concern, instead i took a look at the stuff going on while you connect the phone (do i have to call it blackberry? its a phone, isn’t it?) to your computer.
Continue reading “BlackBerry 10 USB Modes”
Continue readingExtracting Data from Very Large Pcap Files – Part 3: Pcap Filtering in the Cloud
This is the third (and last) part of the series (parts 1 & 2 here). We’ll provide the results from some additional tests supported by public cloud services, namely AWS (Amazon Web Services).
Lab Setup
The Amazon Elastic Compute Cloud (short: EC2) provides a flexible environment for the on demand provisioning of virtual machines of different performance levels. For our lab setup, a so-called extra large instance was used. According to Amazon, the technical specs are the following:
15 GB memory
8 EC2 Compute Units (4 virtual cores with 2 EC2 Compute Units each)
1,690 GB instance storage
64-bit platform
I/O Performance: High
API name: m1.xlarge
Since the I/O performance of single disks had turned out to be the bottleneck in the “local” setup, eight Elastic Block Storage (short: EBS) volumes were created and attached to the instance. Each EBS volume is hosted within a specific availability zone and can be attached to instances running in the same zone. EBS volumes can be created and attached issuing two commands of the amazon ec2 command line tools. Therefore the amount of storage can be scaled up very easily. The only requirement (for our tests) is the existence of a sufficient number of EBS volumes which then contain parts of the pcap file to be analyzed.
Results
During the benchmarks, the performance was significantly lower than with the setup described in the previous post, even though eight different EBS volumes were used to avoid the bottleneck of a single storage volume. The overall performance of the test was seemingly limited by the I/O performance restriction within virtualized instances and virtualized storage systems. Following the overall cloud computing paradigm, performance limitations of this kind might be circumvented by using multiple resources which do the processing in parallel. This could be done by using multiple instances or by using frameworks like Amazon MapReduce which are designed to process huge sets of data. Applying this approach to the analysis of pcap files, the structure of the pcap format carries some inherent problems. The format consists of a binary representation of the data which is structured by the time of the captured packets and not by logical packet traces. Therefore it would be necessary to process the complete pcap file by each instance to extract all streams to identify which streams of the file are to be analyzed by the concrete worker instance. This prevents an efficient distribution of the analysis in multiple jobs or input files. If the captured network data would be stored in separate streams instead of one big pcap file, the processing using a map/reduce algorithm would be possible and thus potentially increase scalability significantly.
That said, finally here are the results of our testing (test methodology described in earlier post):

So it took much longer to extract the data from a 500 GB file which can be attributed to the increased latency times accessing centralized storage (from a SAN/over the network) when compared to locally connected SSDs.
Hopefully this little series provided some insight for you, dear readers. We’ll publish the full technical report as an ERNW Newsletter in the next months.
Have a good one, thanks
Enno
Continue reading
Extracting Data from Very Large Pcap Files – Part 2: Results from the Local Lab
In the first post I’ve laid out the tools and lab setup, so in this one I’m going to discuss some results.
Description of overall test methodology
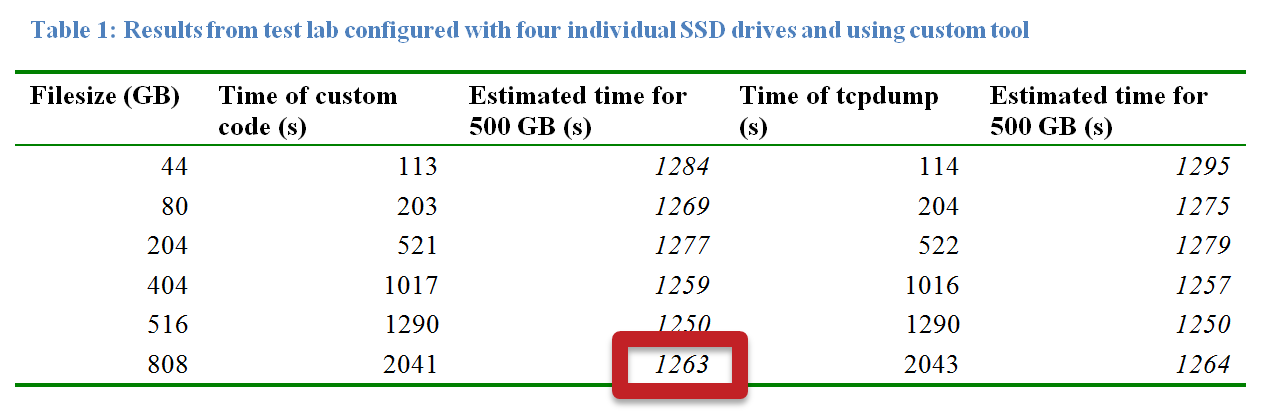
To evaluate the performance of the different setups used to analyze capture data, both tcpdump and pcap_extractor (see last post) were used. For the tests, five capture files were created using mergecap. Various sample traffic dumps were merged to five large files with different file sizes. All these files consisted of several capture files containing a variety of protocols (including iSCSI and FCoE packets). Capture files of ∼40, ∼80, ∼200, ∼500, and ∼800 GB size were created and were analyzed with both tools. For all tests the filtering expressions for tcpdump and pcap_extractor were configured to search for a specific source IP and a specific destination IP matching to iSCSI packets contained in the capture file. Additionally pcap_extractor was “instructed” to look for some search string (formatted like a credit card number).To address the performance bottleneck (again, see last post), that is the I/O throughput, two different setups of the testing environment (see above) were implemented, the first one going with a raid0 approach using four SSD hard drives, the second one with four individual SSD hard drives, each of them processing only a fourth of the analyzed capture file. Standard UNIX time command was invoked to measure the time of execution. Additionally the tools analyzing the data were started with the highest possible scheduling priority to ensure execution with the maximum of available resources. This is a sample command line invoking the test:
/usr/bin/time -hp /usr/bin/nice -n -19 ./pcap_test2 -i $i/in.pcap -o $i/out.pcap -f “ip src 192.168.1.207 and ip dst 192.168.1.208” -s “5486000000620012” > $i/out &
Results
The most interesting results table is shown below:

Conclusions
So actually extracting a given search string from a 500 GB file could be done in about 21 minutes, employing readily available tools and using COTS hardware for about 3K EUR (as of March 2011). This means that an attacker disposing of (large) data sets resulting from previous eavesdropping attacks will most likely succeed in getting the exact data she’s going after. Furthermore the time needed scales in a lineary fashion with the file size, so that processing a 1 TB data volume presumably would have taken ∼42 minutes, a 2 TB file would have taken ∼84 minutes and so on. In addition, SSD prices are constantly declining, too.
Thus it could be shown that the perception that the sheer volume of data gained from eavesdropping attacks on high speed links might prohibit an attacker from analyzing this data is, well, simply not correct ;-).
Risk Assessment & Mitigating Controls
Several factors come into play when trying to assess the actual risk of this type of attack. Let’s put it like this: once an attacker disposes either of physical access to a fibre at some point or is able to get into the transport path by means of certain network based attacks – which are going to be covered in another, future post – collecting and analyzing the data is an easy task. If you have sufficient reasons for trusting the party actually implementing the connection (e.g. a carrier offering Metro Ethernet services) and “the overall circumstances” you might rely on the isolation properties provided by the service and topology. In case you either don’t have sufficient reasons to trust (some discussion on approaches to “evaluate trustworthiness” can be found here or here) or in highly regulated environments, using encryption technologies on layer 2 (like these or these) might be a safer approach.
In the next post we’ll discuss the cloud based test setup, together with its results. Stay tuned &
have a great day,
Enno
Continue readingExtracting Data from Very Large Pcap Files – Part 1: Tools and Hardware
There is a common misconception that the sheer amount of data coupled with multiplexed channels (e.g. WDM technology) make successful eavesdropping attacks on high speed Ethernet links – like those connecting data centers – highly unlikely. This is mainly based on the assumption that the amount of resources (e.g. RAM, [sufficiently fast] storage or CPU power) needed to process large files of captured data is a limiting factor. However, to the best of our knowledge, no practical evaluation of these assumptions has so far been performed.
Therefore we conducted some research and started writing a paper (to be released as a technical report shortly) that aims to answer the following questions:
– Can the processing of large amounts of captured data be done “in a feasible way” ?
– How much time and which type of hardware is needed to perform this task?
– Can this be done with readily available tools or is custom code helpful or even required? If so, how should that code operate?
– Can this task be facilitated by means of public cloud services?
We performed a number of tests with files of different sizes and entropy. Tests were both carried out with different sets of dedicated hardware and by means of public cloud services. The paper describes the tools used, the various test setups and, of course, the results. A final section includes some conclusions derived from the insights provided by the test sets.It is assumed that an attacker has already gained access enabling her to eavesdrop on the high speed data link. A detailed description how this can be done can be found e.g. here or here. The focus of our paper is on the subsequent extraction of useful data from the resulting dump file. It is further assumed the collected data is available in standard pcap format.
We’ll summarize some of the stuff in a series of three blog posts, each discussing certain aspects of the overall research task. In the first one we’ll describe the tools and hardware used. In the second we’ll give the results from the test lab with our hardware while the third part describes the tests performed in the (AWS) cloud and provides the conclusions. Furthermore we’ll give a presentation of the results, including a demo (probably the extraction of credit card information from a file with the size 500 GB which roughly equates to a live migration of 16 virtual machines with 32 GB RAM each) at the Infoguard Security Lounge taking place on 8th of June in Zug/Switzerland.
Last but not least before it get’s technical: the majority of the work was performed by Daniel, Hendrik and Matthias. I myself had mostly a “supervisor role” 😉 So kudos to them!
COTS packet analysis tools
A number of tests utilizing available command-line tools (tethereal, tshark, tcpdump and the like) were performed. It turned out that, performance-wise, “classic” tcpdump showed the most promising results. During the following, in-depth testing phase two problems of tcpdump showed up:
– It’s single-threaded so it can’t use multiple processors of a system (for parallel processing). Given the actual bottlenecks to be related with I/O anyway (see below) this was not regarded to be major problem.
– Standard pcap filters do not allow for “keyword search” which somehow limits the attack scenarios (attacker might not be able to search for credit card numbers, user names etc. but would have to perform an IP parameter based search first and then hand over to another tool which might cause an unacceptable delay in the overall analysis process). To address this limitation Daniel wrote a small piece of code that we – not having found an elegant name like Loki so far 😉 – called pcap_extractor.
Pcap_extractor
This is basically the fastest possible implementation of a pcap file reader. It opens a libpcap file handle for the designated input file, applies a libpcap filter to it and loops through all the filter matching packets, writing them to an output pcap file. Contrary to tcpdump and most other libpcap based analysis tools, it provides the possibility to search for a given string inside the matching packets, for example a credit card number or a username. If such a search string is applied, only packets matching the libpcap filter and containing the search string are written to the output file.A call to search a pcap file for iSCSI packets which contain a certain credit card number and write them to the output file would then look like:
# pcap_extractor -i input-file.pcap -o output-file.pcap -f “tcp port 3260” -s “5486123456789012“
The source code of pcap_extractor can be downloaded here.
Identifying the bottleneck(s)
While measuring the performance of multiple pcap analysis tools the profiling of system calls indicated that the tools spend between 85% and 98% of the search time on waiting for I/O. In case of the fastest tool that means 98% of the time the tool does nothing, but waiting for dump data. So the I/O bandwidth turned out to be the major bottleneck in the initial test setups.
Actual lab setup
The final test system was designed to provide as much I/O bandwidth as possible and was composed of:
Intel Core i7-990X Extreme Edition, 6x 3.46 GHz
12GB (3 * 4GB) DDR3 1600MHz, PC3-12800
ASRock X58 Extreme6 S1366 mainboard
4 * Intel 510 Series Elm Crest SSD 250GB
The mainboard and the SSDs were chosen to support SATA3 with a theoretical maximal I/O bandwidth of 6 Gbit/s. FreeBSD was used as operating system.
===
In this post we’ve “prepared the battle ground” (as for the tools and hardware to be used) for the actual testing, in the next one we’ll discuss the results. Stay tuned & have a great day
Enno
Continue reading